Our world runs on data: it tells us what to eat to stay healthy, what medications are effective, what government policies should be implemented, and what scientific research programs should be pursued. And of course, sales analytics also tells advertisers who is most likely to buy their products, and it tells sales teams who to sell to.
Just as data has shaped the world we inhabit at large, so too can it shape any single business’ sales figures. Indeed, sales teams that want to perform at their best must learn to harness the power of data to inform their decisions and strategies.
To that end, here are 10 of the most important sales analytics that your sales team should watch to boost its revenue.
Win Rate
The win rate is in many ways the simplest sales analytics and also one of the most powerful. As the name implies, the win rate is simply the percentage of deals you “win” or “close.” In more technical terms, it is the number of opportunities you close divided by the total number of deals in your pipeline.
For example, if you had 100 sales opportunities and closed on 30 of them, you would have a win rate of 30%. If you had 637 opportunities and closed on 148 of them, your win rate would be roughly 23%.
The win rate is important because it gives you a broad overview of how effective your sales team is. If your sales team is highly convincing, your win rate will be high. Sales managers can monitor win rates in their Sales CRM to get performance benchmarks that can both be improved upon and used as baselines to manage sales better.
Churn Rate
Churn rate helps businesses and sales teams keep track of how well they are retaining customers instead of focusing entirely on new acquisitions. After all, conventional wisdom says that acquiring a new customer is significantly more expensive than retaining an old one.
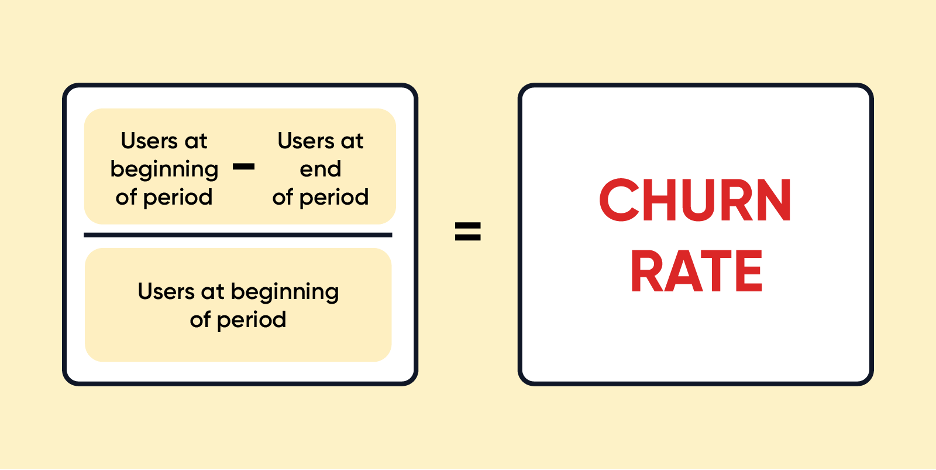
The churn rate is sometimes referred to as the attrition rate. It can be calculated by subtracting the customers at the end of the month from the customers at the beginning of the month and then dividing that number by the customers at the beginning of the month.
So, if you had 100 customers at the beginning of the month and 75 at the end of the month, your churn rate would be 25%. If you had 100 customers to start and had 125 at the end of the month, then your churn rate would be -25%.
Notice how when it comes to this sales analytics, a negative churn rate is actually a good thing, and a positive churn rate is a bad sign. Make sure you don’t get confused when doing your analysis.
Sales Linearity
Sales linearity is another important metric that reveals how regularly your reps close deals. In short, it tells you whether your sales are evenly distributed throughout the month or whether they’re lumped together in sporadic chunks (for example, 100 sales in the first week of the month, but nothing else throughout the month).
Although the calculations are a bit too complex for this guide, this metric can be useful for ensuring that your company has a stable flow of sales throughout the month or year. One effective way to expand your sales team’s arsenal is equipping them with the best webinar software, so they can tap into wider audiences. However, if you have a product that is seasonal or naturally tends to sporadic sales, this metric may be less useful.
Average Profit Margin
Average profit margin is a long-term sales analytics that looks at your profit margin over time. Of course, to understand that, we’ll need to clarify what a profit margin itself is.
Profit margin is a percentage that refers to how much profit your company makes after different expenses are removed. There are three common types of profit:
- Gross Profit Margin = (Revenue – Cost of Goods Sold)/Revenue x 100
- Operating Profit Margin = (Revenue – Cost of Goods Sold – Operating Expenses)/Revenue x 100
- Net Profit Margin = (Revenue – Cost of Goods Sold – Operating Expenses – Taxes – Interest)/Revenue x 100
These measures can provide insight into how efficiently you use resources and how effectively you are pricing your products.
To calculate your average profit margin, you’ll need to take the profit margin for several periods of time and find the average of them. So, the average profit margin for a quarter that had monthly net profit margins of 5.6%, 6.4%, and 6.1% would be 6.0%. But you don’t have to calculate it manually. There is a wide range of apps that can calculate your profit margin automatically. Just enter the numbers in the margin calculator, and the tool will do all the work for you.
Annual and Monthly Recurring Revenue
Annual and monthly recurring revenue (ARR and MRR) are terms that are only relevant to businesses that offer subscription services. So, if that’s not what you’re offering, you can skip over this section. However, for businesses that are offering subscriptions, such as SaaS or monthly gift box subscription services, this metric is practically your lifeblood.
Monthly recurring revenue is simply the amount of revenue your business generates from its active subscriptions over a period of a month. Annual recurring revenue is the same thing except for a period of a year.
For example, if you have 100 active monthly subscriptions, each of which generates $15 of revenue, then your monthly recurring revenue would be $1,500.
Average Revenue Per User
The average revenue per user (ARPU) is a sales analytics that is commonly used by networking, communications, and digital media companies. Nowadays, it is also a very useful measure to keep in mind when SaaS companies are doing sales audits.
ARPU is used to get an idea of how much revenue each individual customer contributes on average to the company’s total revenue.
The ARPU calculation is simple. Just take the total amount of revenue your company generates and divide it by the number of customers you have. For example, if your company generates $1 million per month in revenue and you have 10,000 customers, then your ARPU is $100.

Sales Cycle Length
The sales cycle length is a very straightforward metric. As the name implies, it simply tells you how long the typical sales cycle lasts, i.e how long it takes to go from a prospect to a customer.
Calculating the sales cycle length can be a bit difficult. To do so, you’ll need to add up the total number of days it took to close all the deals that you’re looking at and then divide the number of deals closed by that number.
So, if you’re trying to figure out the sales cycle length for three deals and each one took 30 days, 45, and 25 days to close, then the total number of days you’re looking at is 100. Now, all you need to do is divide 100 by 3 and you’ll see that your sales cycle length is roughly 33 days.
Average Deal Size
Average deal size is exactly what it sounds like: a measure of how much money you get from your average deal. It can be useful because it tells you how much you can expect from every deal you close on average.
To calculate your average deal size, add up the total revenue generated from all the deals you’re analyzing. All you need to do is add them up and divide them by the number of deals.
For example, if your deals were $350, $600, and $475 during the period you’re looking at, your average deal size would be ($350 + $600 + $475)/3 for an average deal size of $475.
Conversion Rate
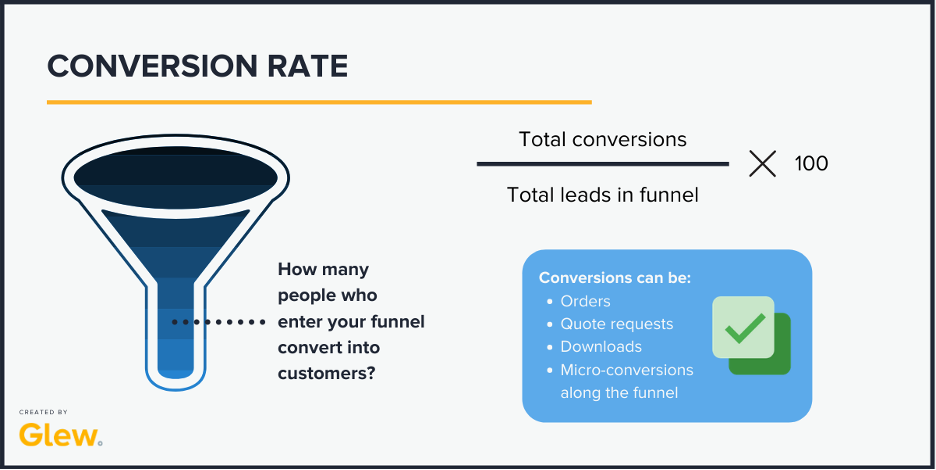
Out of all the sales and marketing methods, this one is likely the one that you’ve heard the most. However, that’s probably because the definition of conversion rate is very broad: it simply means the rate at which people take a specific action, which is typically making a purchase compared to all the leads who showed an interest or clicked on the product and can be easily found with a rank checking software.
But a conversion could be many other things such as signing up for an email list, attending a webinar, taking a free online course, or more. Usually, the data related to conversions are available within whatever online course platform you’re using. For instance, webinar software has robust analytics to not only record attendees, but also time of attendance, personal information, and any calls to action clicked while in the webinar itself.
If you use closing on a deal as your anchoring action, then your conversion rate will turn out to be the same thing as your win rate.
Quota Attainment
Quota attainment is a sales analytics that is entirely internal. Unlike the other metrics we’ve discussed, which could be used by practically any business and finance professional, quota attainment has no relevance out of a sales team.
In short, quota attainment refers to the percentage of sales reps that meet their quotas. For example, if you had 100 salespeople and 80 of them met their quota, then your quota attainment would be 80%.
Conventional wisdom dictates that the sales quotas you set shouldn’t be too high, nor should they be too low. They should be set so that 80% can attain them. If 100% of your team is meeting its quota, you’re probably not challenging or pushing them enough. If less than 80% are meeting your quota, then it may be discouraging to your employees.
Key Takeaways
Businesses that want to stay competitive need to make sure that they have all the sales analytics and data tools they need to keep several paces ahead of their competition. By using the KPIs we’ve listed here, you can begin to take a data or evidence-based approach to the functioning of your sales team, pick out problems, and set realistic goals. Data has reshaped every part of our lives, and you should make sure that you don’t let your sales team get left behind.
Bonus reading: